Q1 2016: San Francisco Market Shifts
In the first quarter of 2016, various market segments in the city began to trend in significantly different directions. Houses, especially those below $2 million, are still often selling in a frenzy of bidding: Recent reports of houses selling with 5, 10 or more competing offers are not uncommon, especially in neighborhoods considered more affordable (by San Francisco standards). Demand remains very high, supply remains extremely low, and new house construction is virtually nil.
However, thousands
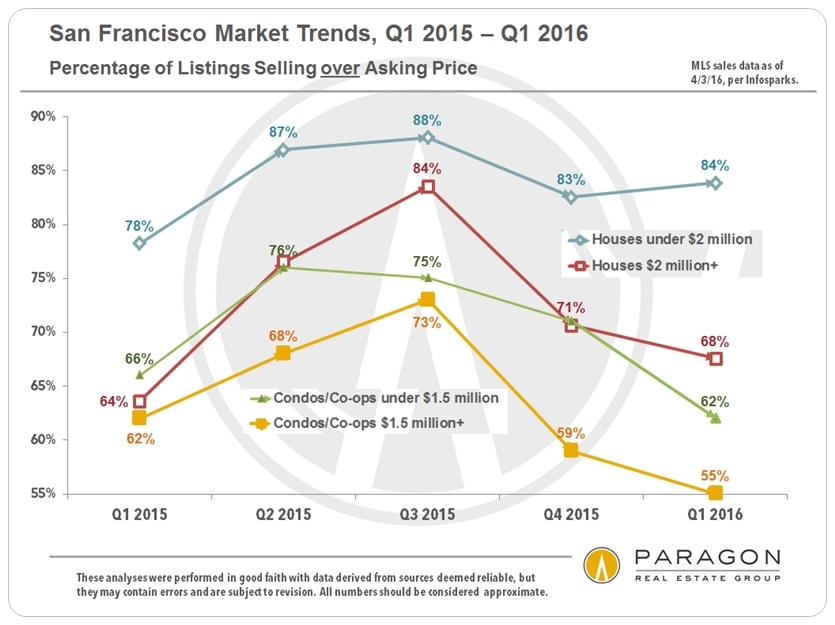
An astonishing 84% of Q1 2016 SF house sales under $2 million sold for over asking price, a very small decline from the most active quarters of last year. The percentage for more expensive houses is 16 percentage points lower than less expensive houses, but still above Q1 2015. Condos, also shown in two price segments, have lower percentages than any time in the past 4 quarters. We shall see if those percentages rebound in Q2, as usually occurs once the spring season warms up, or whether increased inventory dampens overbidding going forward.
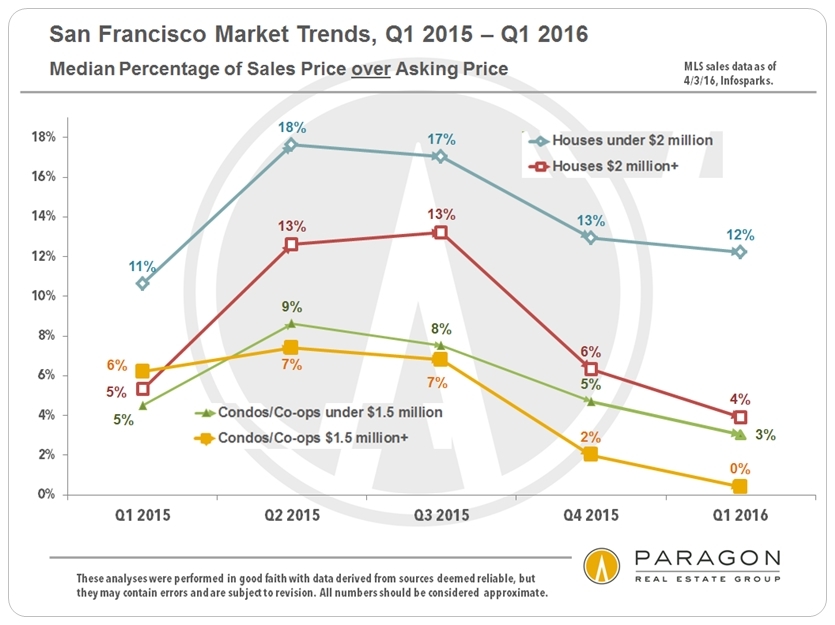
The same trends seen in the first chart above apply to this illustration of the median percentage of sales price over list price over the past 5 quarters. For houses under $2 million, the median percentage over asking price remains incredibly high at 12%, a clear sign of feverish competition between buyers. In contrast, luxury condos overall sold just a tiny bit above list price (less than one half of one percent), and in those districts seeing the most high-rise, luxury condo construction, the median sales price to list price percentage fell well below list price (not shown on chart). More supply means less competition and less sense of urgency in buyers; overbidding becomes rarer and buyers negotiate more aggressively.
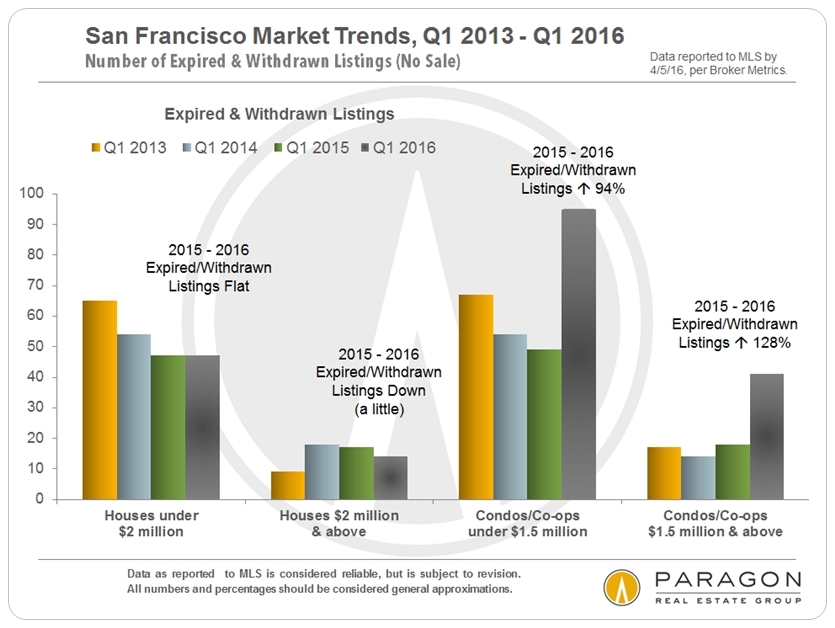
Perhaps nothing is more indicative of a cooling market than increasing numbers of listings expiring and being withdrawn from the market without selling. Q1 2016 saw big jumps in expired/withdrawn condo listings over the first quarters of the previous 3 years. Many such listings end up coming back on the market at lower prices.
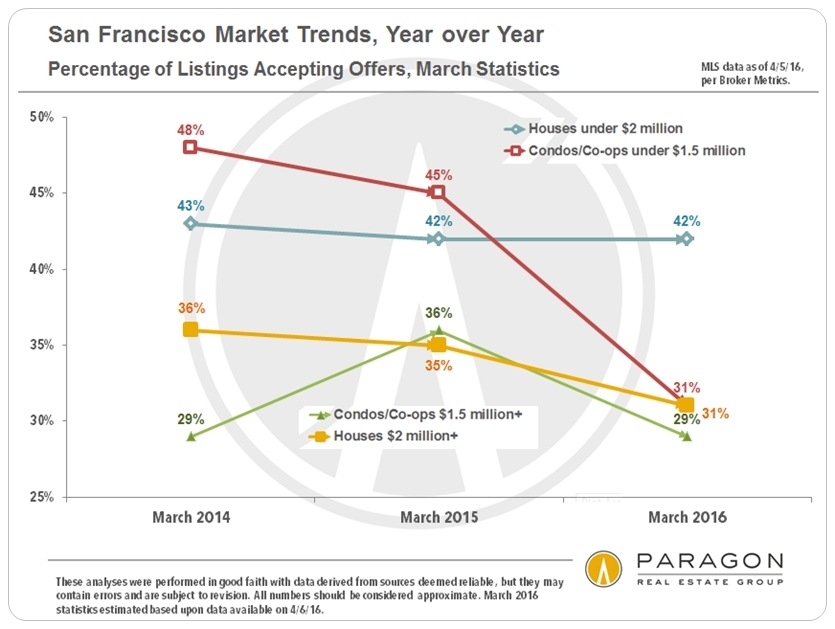
Again, houses under $2 million have maintained a very high level of listings going into contract on a monthly basis. High percentages of this statistic keep inventory low even when increased inventory starts coming on market, analogous to putting food in front of a very fast, hungry eater. However, if a low percentage of listings accepting offers is coupled with increasing numbers of new listings, inventory starts mounting quickly, because more unsold listings from previous months get added on top of the additional new listings streaming onto the market. The slow-eating diner is outpaced by the delivery of new courses, and the table fills up with uneaten food.
San Francisco Median Home Sales Prices
House & Condo, by Quarter
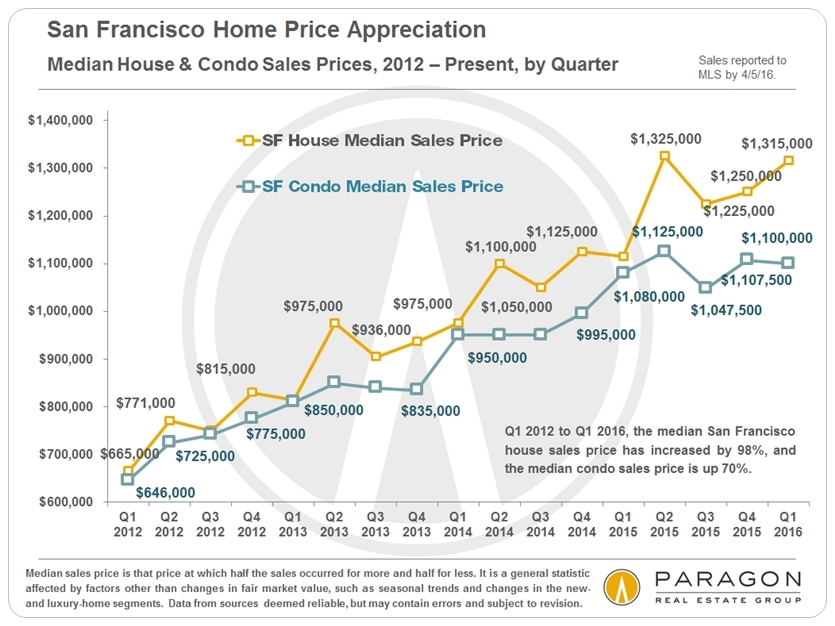
Chart: Median Price Trends since 1993
So far, any market cooling that has occurred is not showing up in Q1 median sales prices: Median prices for both houses and condos remain close to the high points hit in spring 2015. However, for the first time in 4 years, condo median prices did not jump in the first quarter of the year, though neither was there any significant decline.2012 to 2015, overheated spring selling seasons of very high demand and deeply inadequate supplies of homes for sale have fueled most of the home-price appreciation occurring each year in San Francisco. We shall soon know whether this trend will continue this spring, or whether the median prices of some market segments will finally plateau, or even adjust downward with changing supply and demand dynamics.
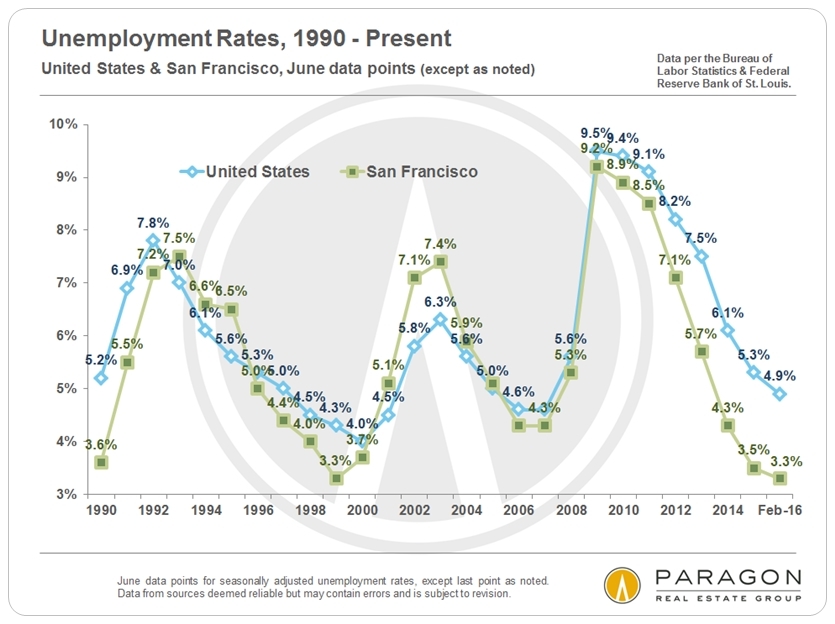
Employment Statistics
Perhaps nothing underpins an appreciating real estate market more than increasing numbers of people moving into an area to take new jobs, especially well paid ones. These charts illustrate the recent explosion of employment in San Francisco and the Bay Area. Of course, employment trends can slow or even reverse directions as occurred after the dotcom bubble burst. It is interesting to note that SF employment (and rents) fell much more after the dotcom adjustment than after the 2008 financial markets crash. On the other hand, SF home prices only temporarily dipped in 2002, while dropping rapidly in late 2008/early 2009 and then remaining depressed until the recovery began in 2012.
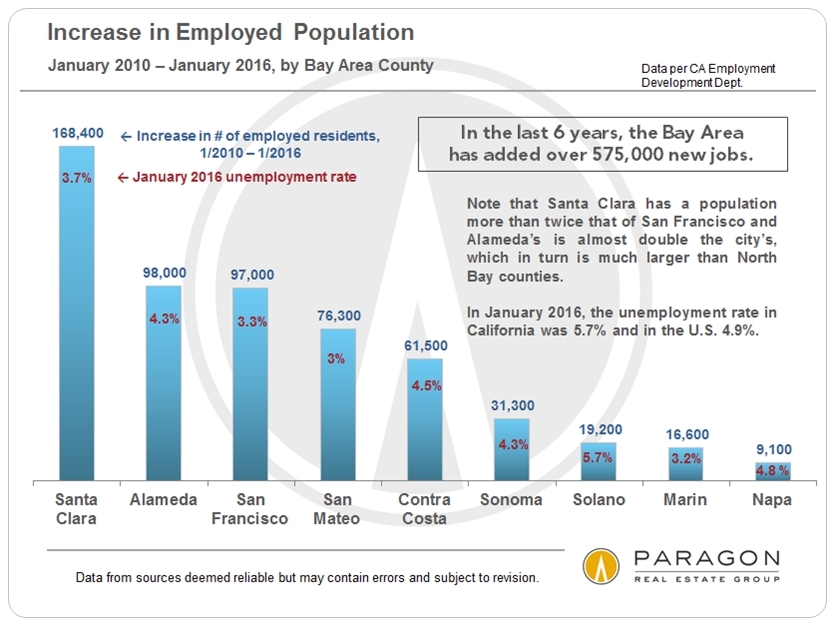
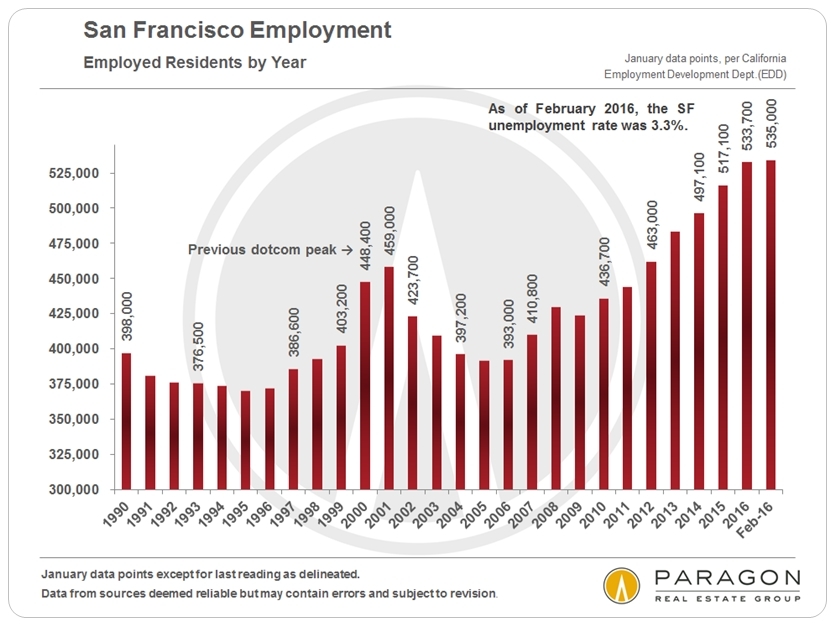
Chart: SF High-Tech Employment Trends
Stock Markets & Interest Rates
After all the travail regarding the stock market volatility since last summer, it is now, as of early April, pretty much back to where it began. And interest rates have actually fallen since the Fed raised the benchmark rate in mid-December. These conditions are typically considered very positive for real estate markets, though both can be subject to sudden and significant change.
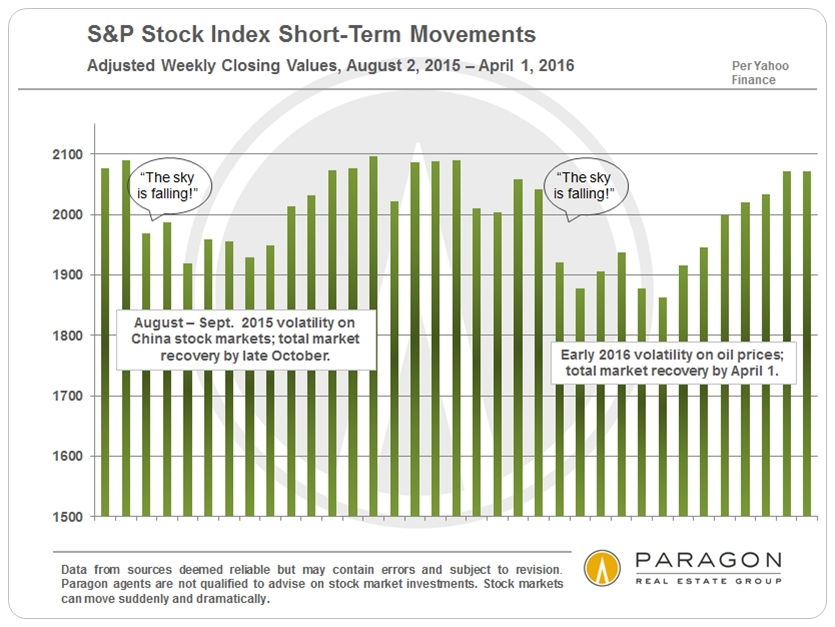
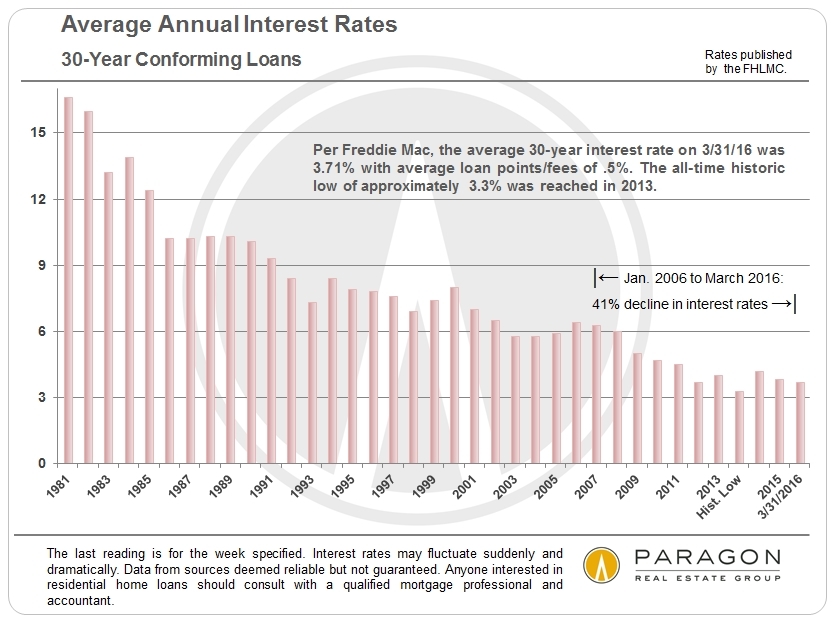
Chart: Short-term Interest Rate Trends
Other recent reports you might find interesting:
San Francisco New-Housing Pipeline
San Francisco Neighborhood Affordability
Seasonality & Real Estate Markets
Bay Area Housing Affordability
S&P Case-Shiller Index for SF Metro Area
These analyses were made in good faith with data from sources deemed reliable, but they may contain errors and are subject to revision. Statistics are generalities and all numbers should be considered approximate. New construction condos not listed or sold on MLS are not counted in these statistics, though they often affect market dynamics. Sales statistics of one month generally reflect offers negotiated 4 to 6 weeks earlier, thus a fair number of YTD 2016 sales reflect market activity in late 2015.
© 2016 Paragon Real Estate Group